
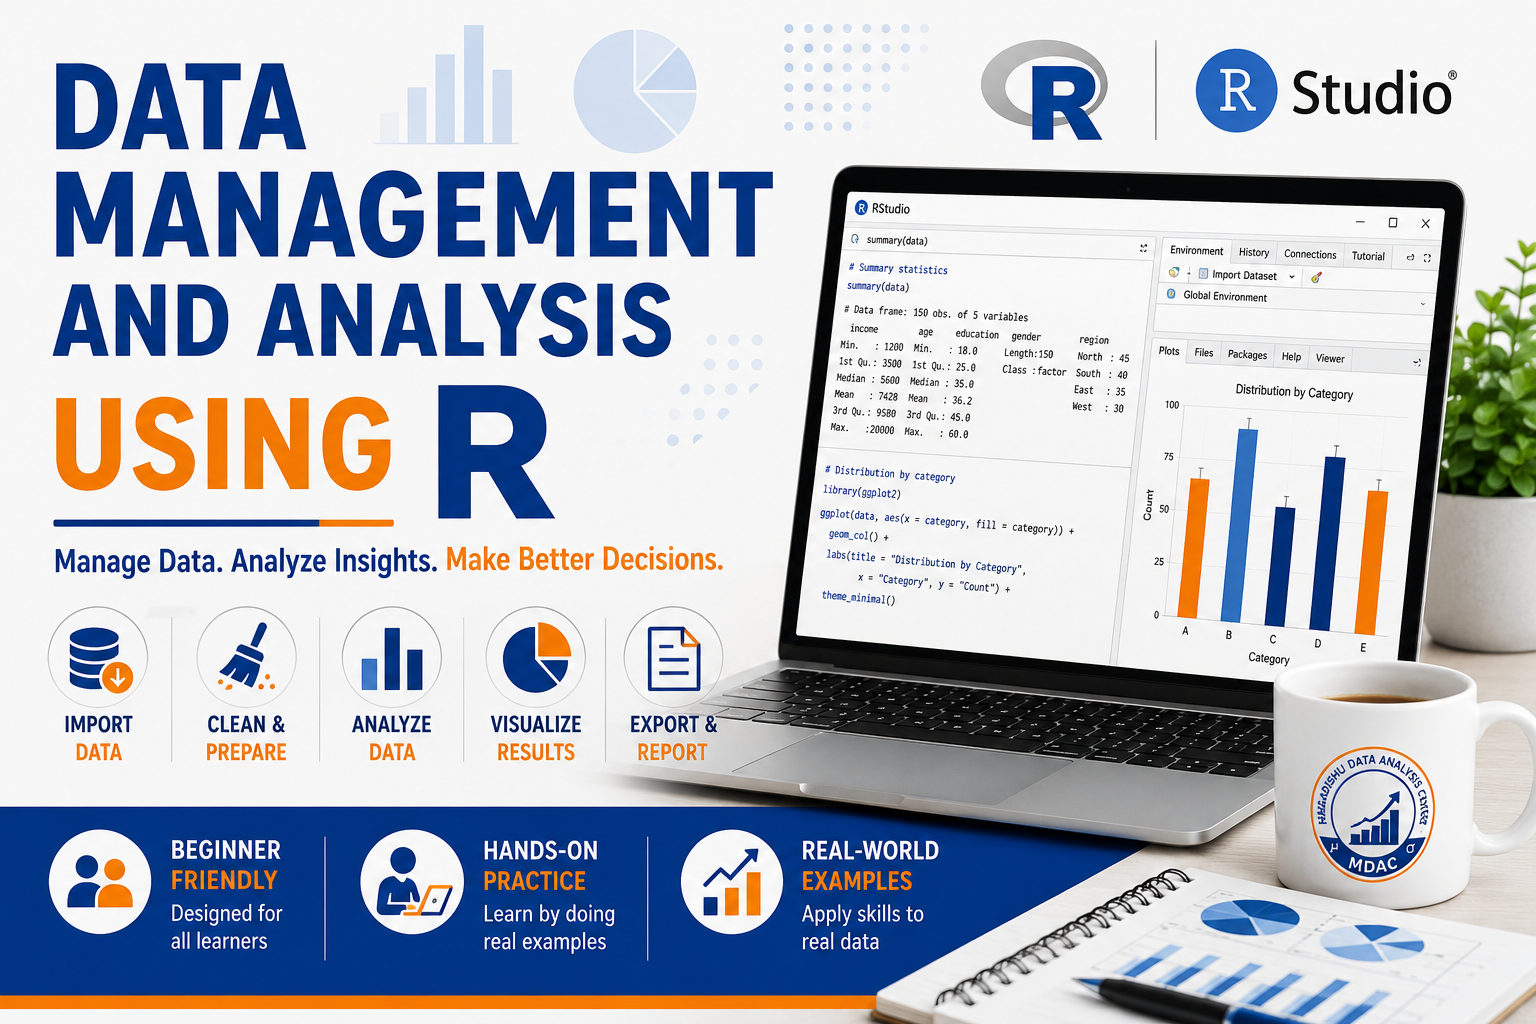
Data Management and Analysis using R

Categories: Data Analysis
Wishlist Share

About Course

This course provides practical skills in data management, cleaning, transformation, analysis, and visualization using R and RStudio. Participants will learn how to import datasets, manage and clean data, perform statistical analysis, create visualizations, and generate reports using real-world datasets and hands-on exercises.

The course is designed for beginners and professionals who want to build strong analytical skills for research, monitoring and evaluation, statistics, public health, social sciences, and data-driven decision-making.

What Will You Learn?

  • Understand the R environment and RStudio.
  • Import datasets from different formats.
  • Clean and manage datasets using R.
  • Conduct basic descriptive analysis.
  • Create tables and graphs.
  • Export analysis outputs for reporting.

Course Content

Module 1: Introduction to R and RStudio
This module introduces learners to the R programming language and the RStudio environment. Learners will install the required software and explore the RStudio interface.

Module 2: R Fundamentals
This module covers the basic concepts of R programming, including variables, variable types, vectors, lists, data frame and basic operators. Participants will learn how to write and run simple R commands and understand the foundational structure of R syntax.

Module 3: Importing Data into R
This module focuses on importing datasets from different file formats such as CSV, Excel, SPSS, and STATA into R. Participants will also learn how to view, inspect, and explore datasets before analysis

Module 4: Data Preparation
This module introduces essential data cleaning techniques required before analysis. Learners will handle missing values, remove duplicates, recode variables, and regroup categories to prepare clean and usable datasets.

Module 5: Data Manipulation
This module introduces the dplyr package for efficient data manipulation in R. Participants will learn how to select variables, rename variables, filter observations, create new variables, group data, and summarize information using simple and powerful commands.

Module 6: Descriptive Statistics
This module covers basic statistical analysis techniques used in data analysis. Participants will generate frequency tables, percentages, cross-tabulations, and summary statistics such as mean, median, and mode to describe datasets effectively

Module 7: Data Visualization
This module introduces graphical presentation of data using bar charts, pie charts, histograms, boxplots, and line graphs to visualize patterns, trends, and distributions within datasets.

Module 8: Generate Reports
This module teaches participants how to save and export analysis outputs from R. Learners will export cleaned datasets, save graphs, and generate simple reports for sharing and presentation purposes.

Earn a certificate

Add this certificate to your resume to demonstrate your skills & increase your chances of getting noticed.
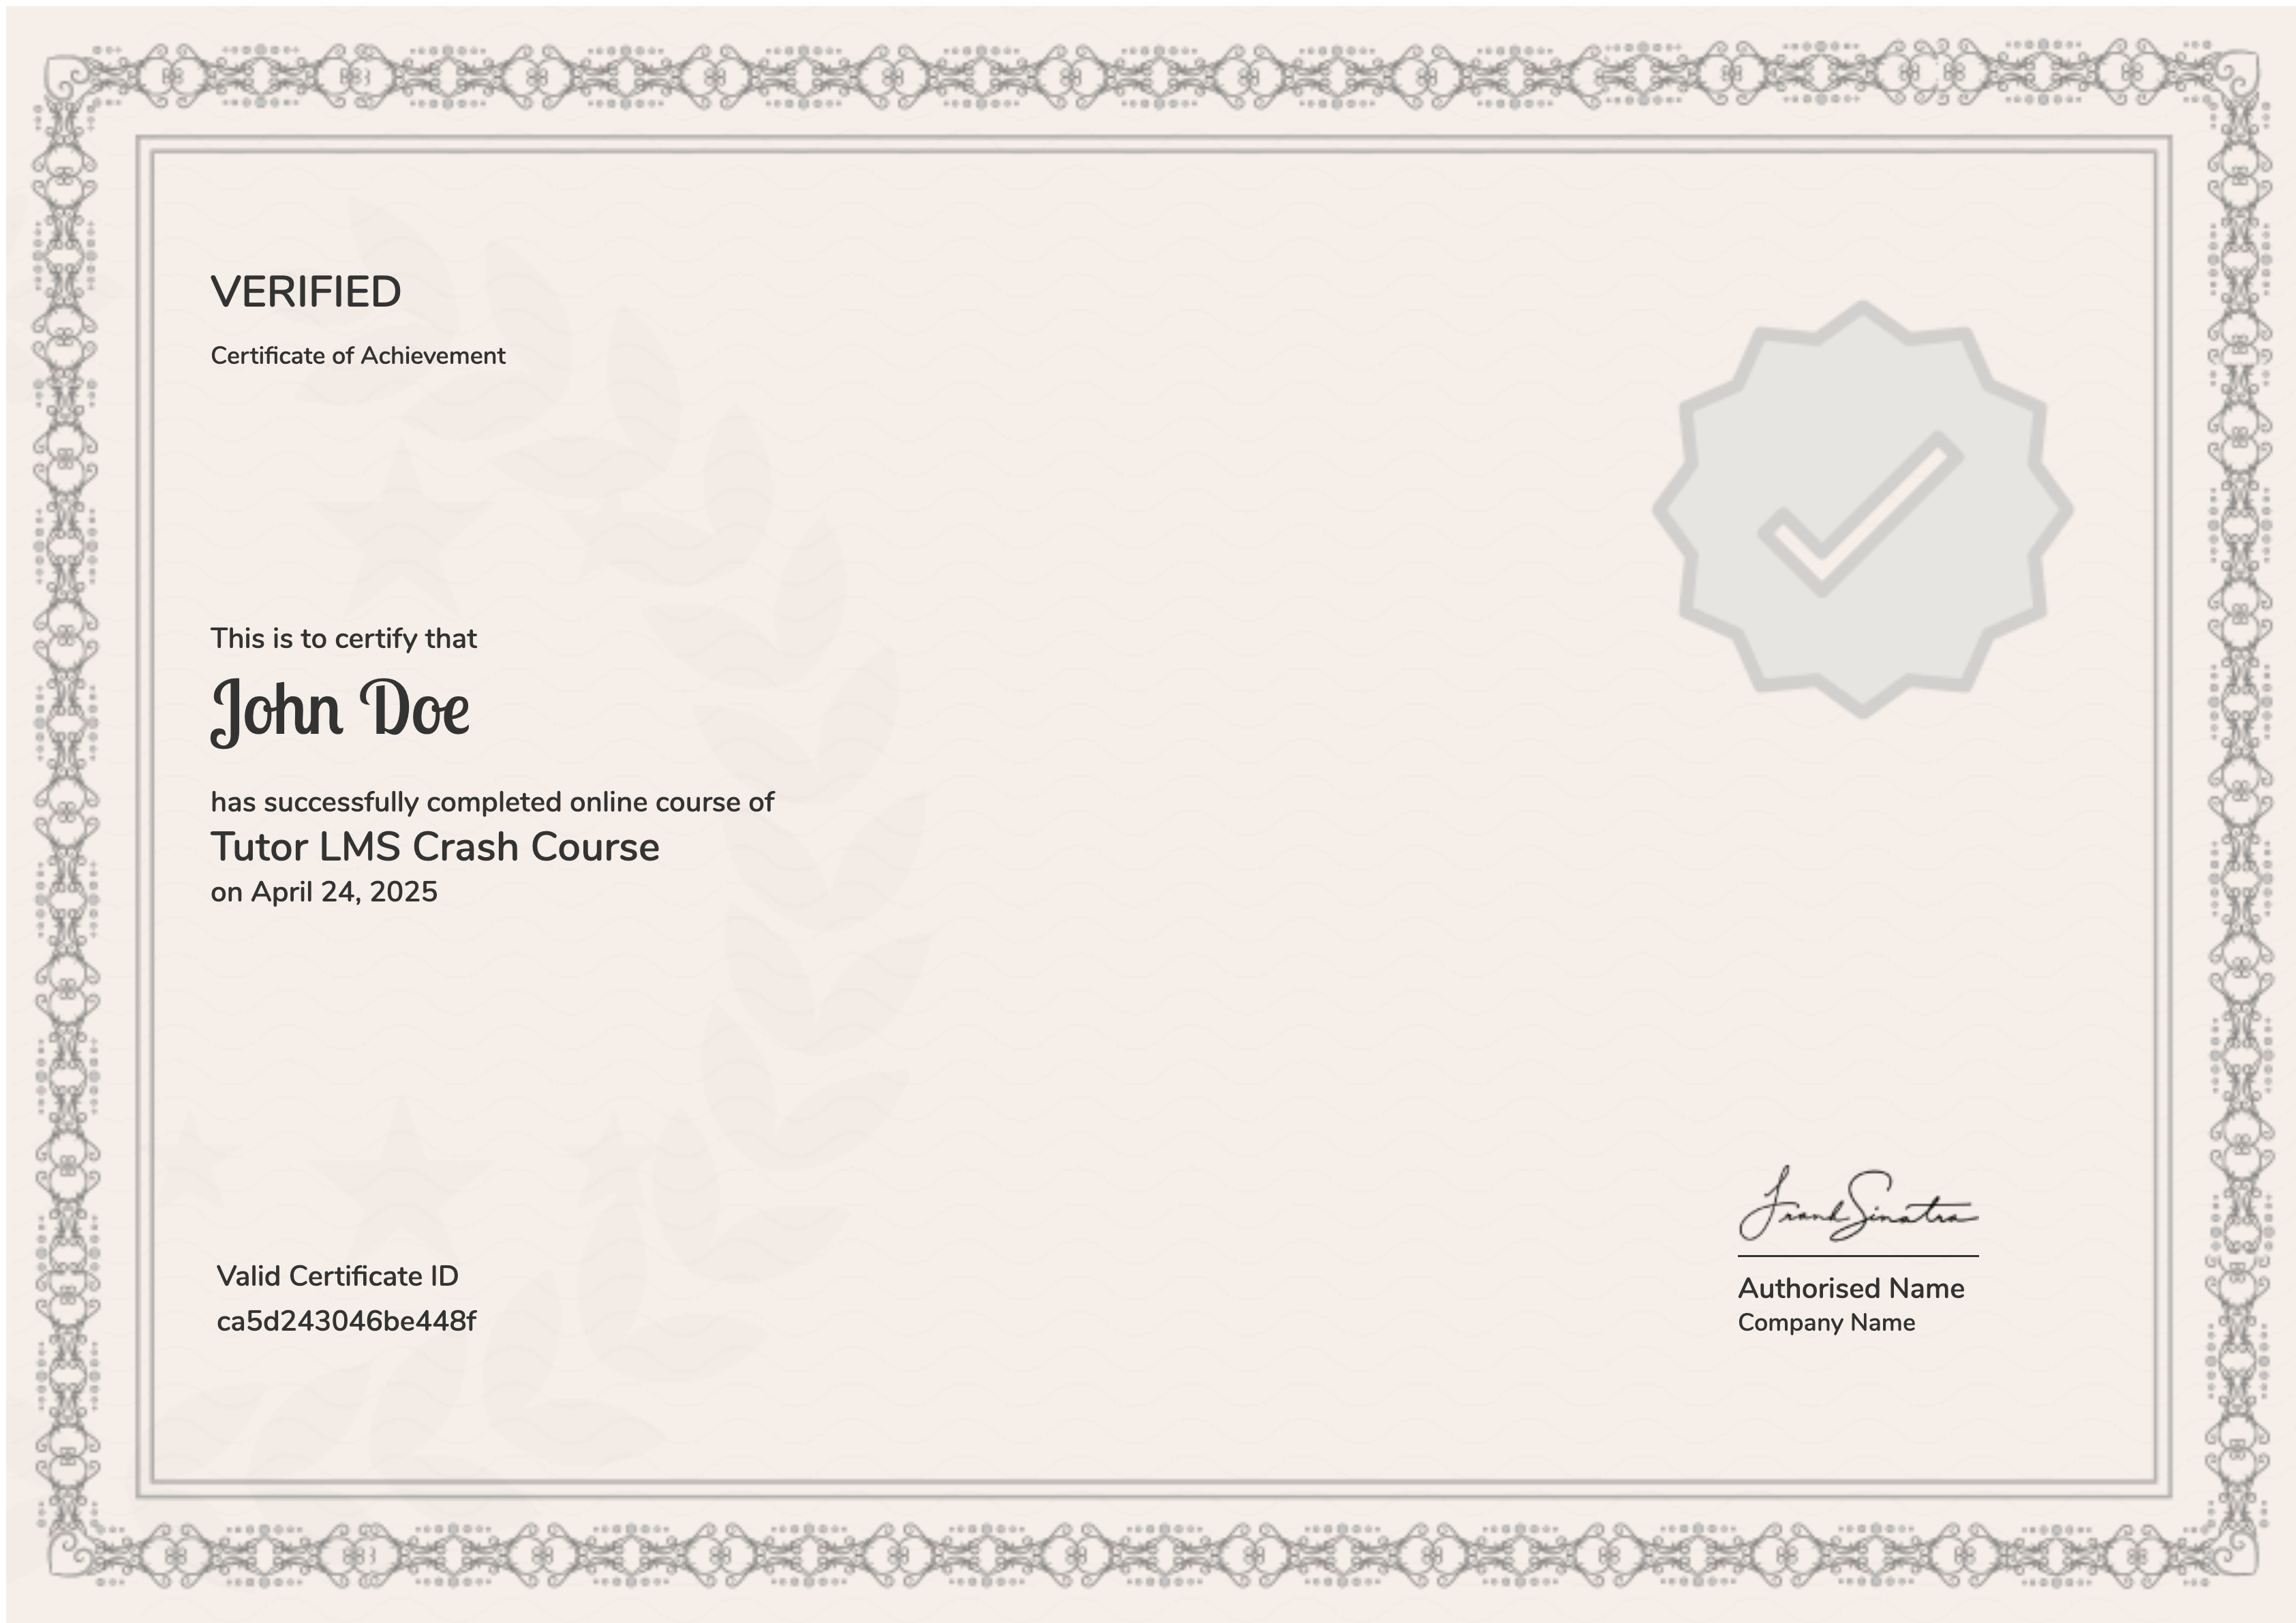
selected template

Student Ratings & Reviews

No Review Yet
No Review Yet