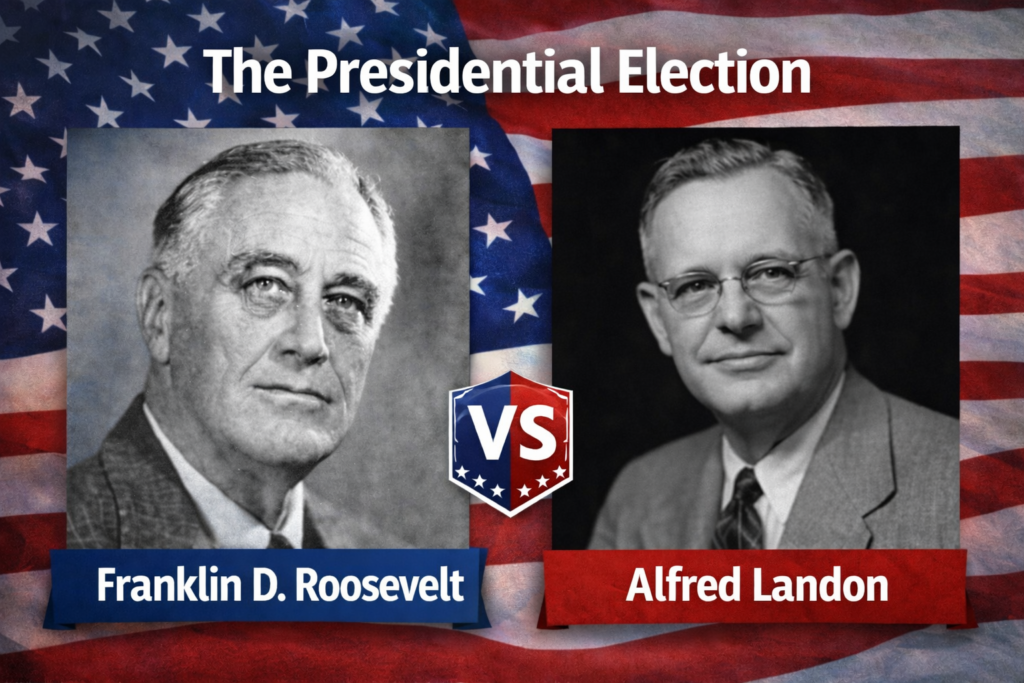
In 1936, the United States faced a historic election between Franklin D. Roosevelt, the incumbent president, and Alf Landon, the Republican governor of Kansas. Roosevelt had become a household name for his bold New Deal programs, aimed at lifting the nation out of the Great Depression, while Landon criticized these policies as overly costly and ineffective
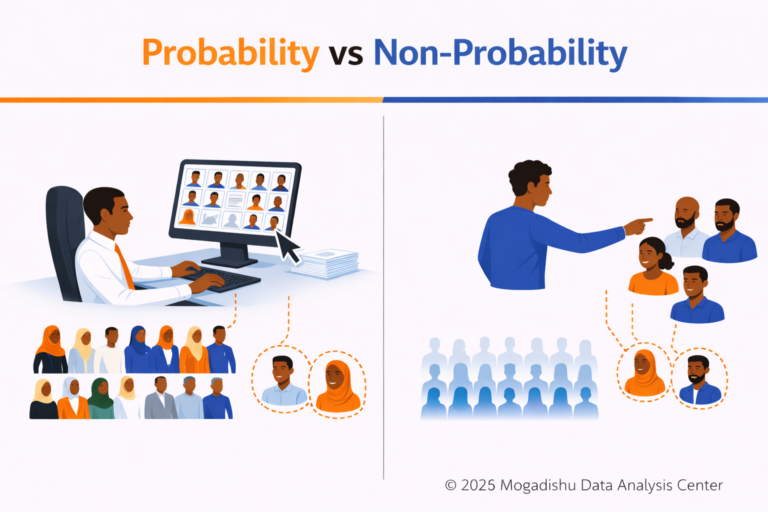
Public opinion
By the 1930s, it had become common for magazines, newspapers, and political organizations to gauge public opinion before an election. Polling was seen as a way to predict who might win to understand the mood of the electorate. One of the most famous magazines surveyed more than two million voters and confidently predicted the wrong presidential winner. Meanwhile, a much smaller survey, conducted by George Gallup, correctly predicted that Roosevelt would win.
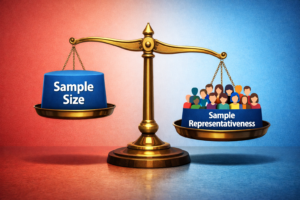
How could a survey of 50,000 people outperform one with over two million responses? The answer lies in one of the most important principles in statistics, a good sample is more important than a big sample. This story remains one of the greatest real-world lessons about sampling, bias, and scientific survey design.
The Literary Digest Poll
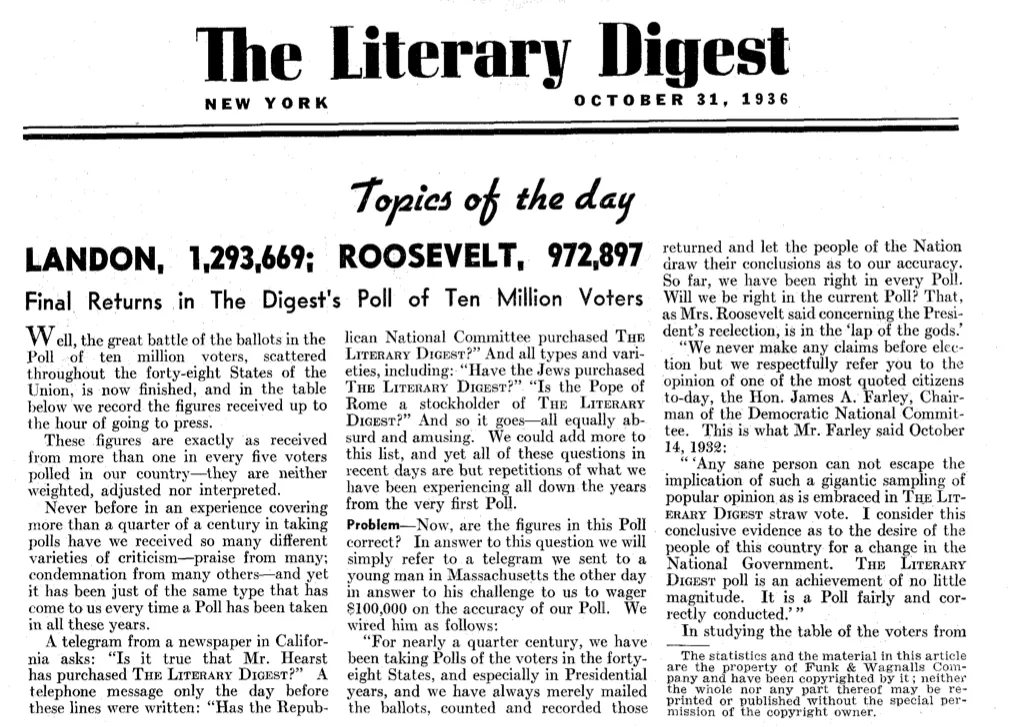
In 1936, Literary Digest mailed approximately 10 million ballots to potential voters asking people to tell them who they planned on voting for in the 1936 presidential election and received back 2.4 million responses (24%). Based on the responses, the magazine predicted that Roosevelt would lose the election about 43%. Unfortunately, as the result turned out, Roosevelt won 62% to 37% of Landon and the prediction was completely wrong. Finally, The Literary Digest magazine ended up and went out of business.
What Went Wrong?
Selection bias: the problem was not the number of responses, it was the selection bias because the magazine selected names from telephone directories, automobile registration lists and magazine subscribers. In 1936, during the Great Depression, many lower-income Americans did not own telephones or cars. As a result, the survey disproportionately represented wealthier voters, who were more likely to oppose Roosevelt.
Response bias: in addition, the poll relied on voluntary responses. Those who chose to mail back the ballot may have had stronger political opinions than those who ignored it. This introduced voluntary response bias. Despite its massive size, the sample was not representative of the voting population.
Response rate: Although 10 million people whose names were on the original mailing list, only about 2.4 million responded to the survey. When the response rate is low (only 24%), a survey is said to suffer from nonresponse bias.
Experts argued that magazine’s sample and the response were both biased and jointly leaded incorrect estimate of the vote. But, if all of those who were polled had responded, the magazine would have, at least, correctly predicted Roosevelt the winner
Gallup’s Approach
At the same time, the American Institute of Public Opinion also carried out a poll asking voters about their intentions in the upcoming presidential election and used a completely different strategy. George Gallup, the founder of the institution, had divided the respondents into groups including state, urban/rural residence, gender, age and income to reflect the structure of the population and used these in the design of his sample.
His sample included around 50,000 people, far smaller than Literary Digest’s sample. As a result, Gallup correctly predicted Roosevelt’s victory with 56% of the vote. This prediction was 6% lower than the actual result, but much closer than The Literary Digest’s prediction. Gallup got it right because he sampled the right people in the right proportions, ensuring the sample truly represented the voting population
Lesson learnt
Statistics is not about collecting many numbers, it is about collecting the right numbers from the right people.